Imaging of brain function
during early human
development
Ernst Martin
Chapter Contents
- Structure–function relationship
- Imaging of brain function
- Developmental neuroimaging
- Mapping visual processing in neonates and infants with fMRI
- Summary
- References
Structure–function relationship
Cerebral structures mature in a predetermined and well-organized way55. Myelination of the central nervous system proceeds slowly during late intrauterine life and rapidly in the neonatal period. Initially there is a dramatic increase in the number of neurons and synapses, which is followed by a subsequent reduction in nerve cell density7, 15, 24
Structural brain maturation has been shown to correlate with behavioral and functional milestones which the neonate and infant attain at various stages of development29. However, our understanding of the brain–behavior relationship has been predominantly based on the correlation between alterations in behavior and changes in brain structure. The majority of our knowledge of localization has resulted from lesion studies in adults, where an intact and mature neural system has been destroyed. Because of the low incidence of focal lesions, this approach has shed little light on the structural variation and connectivity of normal brain development or on the physiology and pathophysiology of brain development. The location, extent and age of occurrence of such anomalies within the developmental trajectory, and the effects of plasticity, may all have implications for the resulting behavioral deficit. In the past, maturational changes have been monitored electrophysiologically and behaviorally, and have been related to age (for a review see Holmes23). Modern imaging techniques provide assessment of the developing brain in vivo at a macroscopic level4, 33, 50Moreover, structural imaging methods have improved our understanding of developmental disorders such as the autistic spectrum and the developmental language disorders13, 25.
< prev | top | contents | next >
Imaging of brain function
In the mature brain specific functions are carried out at anatomically distinct cortical regions42. These areas are highly interconnected by a network of excitatory local circuitry. Corresponding anatomical and functional structures exist to varying degrees in the immature brain of neonates and infants. Detailed anatomical and functional mapping of the various sensory, motor and cognitive tasks the brain performs is necessary in order to understand how the brain works at the various stages of development. Co-registration of structural and functional images provides a platform for identifying the structures delineated by activation patterns in combination with morphometry to quantitatively map active brain structures.
Functional neuroimaging allows us to precisely describe where specific operations are carried out, how large and widely distributed these functional sites are, and how they are interconnected to form a functional unit.
Positron emission tomography (PET), single photon emission CT (SPECT), multidetector electro-encephalography and more recently magneto-encephalography are established techniques and have led to a better understanding of functional connectivity within the brain. Temporal and spatial relationships have been identified between the metabolic rate of glucose11, 12the metabolic rate of oxygen1, 51 and cerebral blood flow 40, 52 in distinct neuroanatomic regions during brain maturation. These processes are regulated in such a way as to meet the instantaneous energy requirements with changing cerebral activity of distinct regions that are functionally important during specific developmental periods11, 3.
The fact that neuronal activity and cellular metabolism are coupled to cerebral blood flow was postulated over 100 years ago46. However, the link between neuronal activity and local cerebral blood flow (CBF), whether in response to vasoactive neurotransmitters from the abundant perivascular nerve supply32, 44, or to other chemical compounds27, 45 still remains to be determined32, 39. Thus, the underlying mechanisms leading to the MR signal and contrast changes especially during the initial phase after neuronal activation are not yet fully understood20. PET studies have shown that functionally induced increase in neuronal activity leads to a proportional increase in the local cerebral metabolic rate of glucose (lCMRGluc) and oxygen (lCMRO2), but to a disproportionate increase of the local cerebral blood flow (lCBF17). The consequences are an increase in the ratio of oxyhemoglobin to deoxyhemoglobin in the capillaries and small veins draining the active brain region. This causes a transient functionally induced hyperoxemia53. This non-linear relationship between oxygen consumption and oxygen delivery9 has also been explained by an ‘uncoupling’ of the neuronal oxidative metabolism18.
The signal arising from water protons can be used in functional MRI (fMRI) as well as functional spectroscopy (fMRS) to monitor cerebrovascular changes associated with brain function5, 2. Whereas fMRI primarily makes use of the paramagnetic effect of deoxygenated hemoglobin as an internal contrast agent (see below), fMRS depends on local changes in proton spin density, magnetic susceptibility21 and metabolite concentrations, for example lactate43. fMRI has distinct advantages over other functional techniques. It is non-invasive and makes no use of radioactivity, it permits simultaneous registration of functional and anatomical data within the same imaging modality, and is fast and has a superior spatial resolution compared to the other methods such as PET.
Blood oxygen-level dependent contrast (BOLD) reflects local changes in blood oxygenation that accompany brain activation. Changes in the relative concentration of oxy- and deoxyhemoglobin cause magnetic susceptibility variations which can be expressed as changes of T2* relaxation rates. BOLD contrast forms the basic mechanism underlying fMRI28, 41. It has dramatically improved our understanding of brain function. However, several pitfalls limit the value of the technique19. Both fast gradient echo and fast spin echo techniques have been used extensively in the past with success. The former offers a good signal to noise ratio, but greater sensitivity to larger vessels, the latter offers sensitivity to microvasculature but of a lower signal to noise ratio. Echo-planar imaging (EPI) is a very fast data acquisition technique which reduces intrabrain motion artifacts and allows whole brain imaging in multislice and even true 3D mode, with a high signal to noise ratio. However, it requires special and expensive hardware and software for data acquisition and postprocessing. 3D and multislice (more than 20 contiguous slices) techniques are essential to detect unexpected activation sites and complex interneuronal connectivity during higher order cognitive processing. Event related ultrafast echo-planar pulse sequences, with single plane imaging times of 40–80ms, promises to resolve the stimulus-dependent vascular response function. This technique is able to deconvolve neuronal events with time scales of the order of the vascular response. An alternative strategy for investigating neonates and infants with fMRI is the use of completely silent pulse sequences allowing functional imaging without any gradient noise. These new methodological developments have improved BOLD contrast fMRI; so that it is now set to become the principle functional imaging tool (Fig. 18.1).
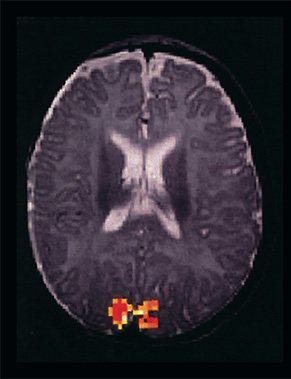
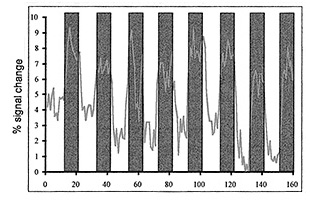
Fig. 18.1 (a) (left): Functional MRI of a 5-month-old child depicting visual activity in the striate cortex. The image is composed of a statistical image based on the result from the cross-correlation analysis, overlaid on an anatomical image. (b) (right) The change in the BOLD signal in the activated region during periods of stimulation (boxed area) and periods without stimulation.
< prev | top | contents | next >
Developmental neuroimaging
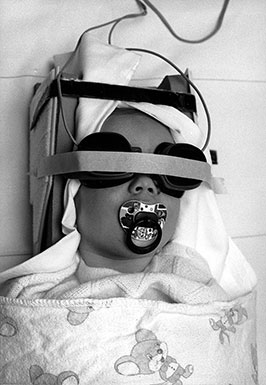
Fig. 18.2 An infant prepared for an fMRI measurement. The flicker-goggles are placed over the eyes and the tape serves merely to hold them in place. Care is taken not to apply excessive pressure on the goggles. The padded headhold provides the infant with the necessary head stability and prevents head movements.
Developmental neuroimaging extends the analysis gained from adults to include the temporal evolution of a structure and associated function. It provides monitoring of the physiological, structural and functional plasticity during early postnatal life by identifying the size and distribution of processing components of discrete elementary operations. The ultimate expectation is that it will reveal typical activation patterns that define sensory inputs, contribute to cognitive tasks and eventually lead to distinct behavioural operations in the child. Such measures of structure–function relationship may well need to be explored in the normal developing brain, as well as in cases of brain dysfunction and delayed maturation.
fMRI is completely non-invasive and allows repeated measurements to be taken from the same subjects to assess intrasubject reproducibility and perform longitudinal studies. It is well suited to the study of infants and children. There are, however, constraints in fMRI of neonates and infants. The images should provide high spatial resolution and good contrast, while the total imaging time should be low. Artifacts produced by head movements are a serious obstacle to successfully collecting functional data. The high level of acoustic noise from fast switching gradients in echo planar imaging sequences not only frightens children but is also a major source of anxiety for the attending parents. Moreover, typical fMRI experiments require that specific tasks be performed by the subject under investigation over an extended period of time. All these aforementioned points render neonates and infants poor candidates for MRI studies. A solution to this problem is to examine young children during natural sleep or under sedation. This requires the development of paradigms and fMRI methods that impose no demands on patient co-operation, for example visual stimulation through the closed eyes (Fig. 18.2). Pentobarbital and chloral hydrate are often used in children during clinical MR examinations to avoid movement artifacts and claustrophobia. In the past, barbituates have been shown to suppress the CBF and CMRO2 in a dose-dependent manner26, 38. More recently, thiopental has been shown to lower the amplitude of visually evoked potentials10 and to reduce the increase in regional CBF (rCBF) in response to somatosensory stimulation in rats31. However, careful analysis of the cortical activity in response to visual stimulation in pentobarbital-sedated adult volunteers has revealed changes in neuronal activity and metabolism to be much smaller than to the reduction in rCBF36.
To perform consistent and reproducible functional experiments with reliable results in neonates and infants, these issues need to be addressed.
< prev | top | contents | next >
Mapping visual processing in neonates and infants with fMRI
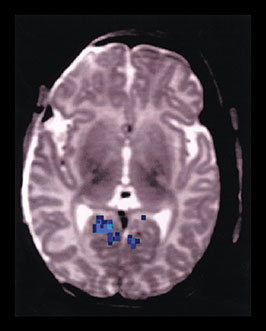
Fig. 18.3 Functional MRI showing visual activity in a neonate. Compared to the fMRI signal of older infant (see Fig. 18.1 (a)) the signal differs in both location and polarity. While the visual activity is more anteriorly located in the calcarine sulcus, the BOLD signal is lower during the periods of stimulation than during the rest periods, (i.e. negatively correlated as indicated in blue).
During the early postnatal months one of the most interesting areas of functional maturation is the development of vision2. For a long time, the accepted theory on visual processing was that the entire visual system was functional from birth, inefficient at first but maturing rapidly6, 22. Research on animals then led to the conclusion that two visual systems co-exist47. Diamond and Hall14 and later Bronson8 proposed that a secondary, phylogenetically older, extrageniculate visual system, which consists of a number of subcortical structures such as the superior colliculi and thalamic nuclei, may play an important role in neonatal and infantile visual behavior, such as smooth tracking of a slowly moving object. However, this system is not capable of providing conscious visual perception in humans. This hypothesis is in line with early metabolic maturation of thalamic afferent pathways and thalamic CBF11, 52 indicating thalamic activity in neonates.
The secondary visual system mainly processes stimuli falling outside the central area of the retina and has direct connections to various extrastriate visual cortical areas. The involvement of this older subcortical system in visual perception of neonates has been described earlier16, 48. Testing the visual performance of premature infants with hypoxic–ischemic and hemorrhagic brain lesions clinically it was found that lesions near the thalami, such as periventricular hemorrhage extending into the basal ganglia were more likely to affect visual behavior than substantial infarction of the occipital cortex. These findings have been confirmed recently37. Infants who later became cortically blind seemed to retain their ability to track and show pattern preference until about 2 months postnatally, depending on their gestational age. It is concluded that these functions do not require cortical integrity, but are most probably mediated through subcortical pathways. Moreover, the time when the affected neonates apparently lost their ability to track objects seems to coincide with the time at which binocular vision is first demonstrable. This is a function which is thought to be cortically mediated. Thus, cortically mediated visual processes, which involve cognitive processes in order to identify the target object in the foveated area, only start to function during the first 3 months of life. They are mediated via the primary visual pathway passing via the lateral geniculate bodies and entering the cortical visual processing area in V1. Nevertheless, different cortical mechanisms appear to be operational at different postnatal times.
Visual acuity, binocular vision and other visual attributes seem to mature in a predetermined manner54. Vision probably plays a relatively minor role during postnatal adaptation. However, it is rapidly developing during the first months of life and may become the most important sense with which the infant explores his or her environment and achieves social contact. Vision then forms the basis for perceptual and future cognitive, intellectual and social function3. It is not surprising that the primary visual area is one of the earliest neocortical structures to mature and to obtain specific functions. Whereas cortical rCBF and rCMRO2 are lower in neonates compared to older children and adults, the respective ratio is greater than one in the primary visual area of neonates compared to adults51. In investigating visual processing during brain development, our interest focused primarily on where different visual tasks are processed in relation to the developmental stage of the brain and their relation to the complexity of the visual stimulus; that is, the developmental plasticity of vision. As the child grows older and starts to analyze and understand the visual input, the interrelation of visual and cognitive processes becomes of major interest. More recently, studies have concentrated on the reparative plasticity of the brain; that is, how the brain compensates for functional impairments created by various brain lesions affecting the visual system at different time points during development.
Our group has investigated developmental aspects of the human visual system that take place during early postnatal life by studying its cortical activity in response to visual stimulation using fMRI. This enabled us to elucidate the role of the primary visual cortex and prestriate areas in the processing of visual information at different stages of brain development. Seventy-five infants and children of different ages have been investigated during visual stimulation either with 8 Hz LED flashing goggles, or with computer controlled checkerboard paradigms presented to the subjects in the magnet via a video-goggle system34. The results of the cross-correlation analysis obtained from the children were compared to those of normal healthy adult volunteers, with specific emphasis on: (i) exact location of the response signals within the primary visual cortex and the prestriate areas; (ii) their spatial distribution; and (iii) the effect of anesthesia. The results can be summarized as follows: using the same stimulation paradigms, small children generally exhibit lower activity than older children and adults in V1. In neonates (n = 12) nine did not show significant stimulus related activation in the visual cortex, whereas two exhibited negatively correlated signal changes in the prestriate area (Fig 18.3). The characteristic positive BOLD contrast related signal change observed in adults during visual stimulation could only be found in two newborn infants in the pulvinar thalami. Among 12 infants, aged 1–12 months, four showed positive, and five negative activity. In three, no activity could be found. These findings contrast to a 100% positive stimulus related signal change observed in 12 children above the age of 6 years. In the instances where a negative BOLD contrast signal was observed, the site of the activity was usually located more anteriorly in the calcarine sulcus compared to the positive signal changes in V1. From anatomical slices the exact locus of the negatively correlated signal change was judged to correspond to the extrastriate cortical visual area V1. In fact, the majority of toddlers showed stimulus-related activity in V2, rather than V1. The presence of a negative BOLD contrast signal in area V2 confirms earlier electrophysiological findings that activation of extrastriate cortex to visual stimulation can be detected from birth using fMRI. Moreover, careful investigations with fMRI and fMRS reveal activity-related signal changes not only in the prestriate cortex, but also in subcortical areas in some cases, indicating activity of the secondary visual pathway in the very young (Fig. 18.4). It is concluded that the process of postnatal visual development can be viewed as a progressive encoding of increasingly more complex aspects of information contained in the visual signal within different components of the visual network.
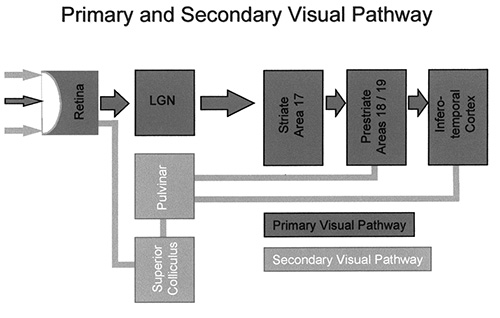
Fig. 18.4 Schematic representation of the primary and secondary visual pathway. In the primary visual pathway the signal from the retinal fovea is passed via the dorsal lateral geniculate nuclei to the striate cortex (V1) and subsequently to the extrastriate cortical visual areas. In the secondary visual pathway signals from more peripheral parts of the retina are passed via subcortical structures such as the superior colliculi and the pulvinar thalami directly to the extrastriate, cortical, visual areas.
With recent developments of ultra-fast and silent imaging techniques fMRI has reached a point where functional maps of the cortical visual areas involved in processing the attributes of a stimulus, such as orientation, motion and color can now be determined in the very young.
< prev | top | contents | next >
Summary
- Functional MRI can be produced by blood oxygen level dependent (BOLD) changes in the brain with neuronal activity.
- Sequences may be too noisy to perform during natural sleep and therefore sedation is usually necessary.
- The development of silent sequences will improve the rate of successful examinations.
- The effects on brain activity as a result of sedation must be considered.
- Functional imaging of the unco-operative newborn is restricted to those paradigms that can be performed with a sleeping infant.
- Excitation of the visual system through closed eyes is the main paradigm to be used in the neonate to date.
- The patterns of visual activation are distinct from those found in the adult.
< prev | top | contents | next >
References
- Altman DI, Perlman JM, Volpe JJ et al. (1993) Cerebral oxygen metabolism in newborns. Pediatrics 92, 99–104.
- Atkinson J (1984) Human visual development over the first 6 months of life. A review and a hypothesis. Hum Neurobiol 3, 61–74.
- Atkinson J (1992) Early visual development: differential functioning of parvocellular and magnocellular pathways. Eye 6, 129–135.
- Barkovich A, Kjos JB, Jackson OD et al. (1988) Normal maturation of the neonatal and infant brain: MR imaging at 1.5 T. Radiology 166, 173–180.
- Belliveau J, Kwong K, Kennedy D et al. (1992) Magnetic resonance imaging mapping of brain function. Human visual cortex. Invest Radiol 27(Suppl 2), S59–65.
- Bond E (1972) Perception of form by the human infant. Psychol Bull 77, 225–245.
- Brody B, Kinney H, Kloman A et al. (1987) Sequence of central nervous system myelination in human infancy. 1. An autopsy study of myelination. J Neuropathol Exp Neurol 46, 283–301.
- Bronson G (1974) The postnatal growth of visual capacity. Child Dev 45, 873–890.
- Buxton RB and Frank LR (1997) A model for the coupling between cerebral blood flow and oxygen metabolism during neural stimulation. J Cereb Blood Flow Metab 17, 64–72.
- Chi OZ, Ryterband S and Field C (1989) Visual evoked potentials during thiopentone–fentanyl–nitrous oxide anaesthesia in humans. Can J Anaesth 36, 637–640.
- Chugani H and Phelps M (1986) Maturational changes in cerebral function in infants determined by 18-FDG positron emission tomography. Science 231, 840–843.
- Chugani H, Phelps M and Mazziotta J (1987) Positron emission tomography study of human brain functional development. Ann Neurol 22, 487–497.
- Courchesne E, Yeung-Courchesne R, Press GA et al. (1988) Hypoplasia of the vermial lobules VI and VII in infantile autism. N Engl J Med 318, 1349–1354.
- Diamond I and Hall W (1969) Evolution of neocortex. Science 164, 251–262.
- Dobbing J and Sands J (1973) Quantitative growth and development of human brain. Arch Dis Child 48, 757–767.
- Dubowitz L, Mushin J, De Vries L et al. (1986) Visual function in the newborn infant: is it cortically mediated? Lancet 1, 1139–1141.
- Fox PT, Raichle ME, Mintun MA et al. (1988) Nonoxidative glucose consumption during focal physiologic neural activity. Science 241, 462–464.
- Frahm J, Kruger G, Merboldt KD et al. (1996) Dynamic uncoupling and recoupling of perfusion and oxidative metabolism during focal brain activation in man. Magn Reson Med 35, 143–148.
- Frahm J, Merboldt KD, Hanicke W et al. (1994) Brain or vein – oxygenation or flow? On signal physiology in functional MRI of human brain activation. NMR in Biomedicine 7, 45–53.
- Frostig RD, Lieke EE, Ts’o DY et al. (1990) Cortical functional architecture and local coupling between neuronal activity and the microcirculation revealed by in vivo high-resolution optical imaging of intrinsic signals. P Natl Acad Sci USA 87, 6082–6086.
- Hennig T, Ernst T, Speck O et al. (1994) Detection of brain activation using oxygenation sensitive functional spectroscopy. Magn Reson Med 31, 85–90.
- Hershenson M (1967) Development of the perception of form. Psychol Bull 67, 326–336.
- Holmes GL (1986) Morphological and physiological maturation of the brain in the neonate and young child. J Clin Neurophysiol 3, 209–237.
- Huttenlocher P, De Courten C, Garey L et al. (1982) Synaptogenesis in human visual cortex – evidence for synapse elimination during normal development. Neurosci Lett 33, 247–252.
- Jernigan TL, Hesselink JR, Sowell E et al. (1991) Cerebral structure on magnetic resonance imaging in language-impaired and learning-impaired children. Arch Neurol 48, 539–545.
- Kety S, Woodford R, Harmel M et al. (1947–48) Cerebral blood flow and metabolism in schizophrenia. The effect of barbiturate semi-narcosis, insulin coma and electroshock. Am J Psychiat 104, 765–770.
- Kuschinsky W (1990) Coupling of blood flow and metabolism in the brain. J Physiol Pharmacol 1, 191–201.
- Kwong K, Belliveau J, Chesler D (1992) Dynamic magnetic resonance imaging of human brain activity during primary sensory stimulation. P Natl Acad Sci USA 89, 5675–5679.
- Langworthy O (1933) Development of behavior patterns and myelinization of the nervous system in the human fetus and infant. Contrib Embryol Carnegie Inst 24, 3–57.
- Lassen NA, Ingvar DH and Skinhoj E (1978) Brain function and blood flow. Scientific American 239, 62–71 [Review].
- Lindauer U, Villringer A and Dirnagl U (1993) Characterization of CBF response to somatosensory stimulation: model and influence of anesthetics. Am J Physiol 264, 1223–1228.
- Lou HC, Edvinsson L and MacKenzie ET (1987) The concept of coupling blood flow to brain function: revision required? Ann Neurol 22, 289–297.
- Martin E, Boesch C, Zuerrer M et al. (1990) MR imaging of brain maturation in normal and developmentally handicapped children. J Comput Assist Tomogr 14, 685–692.
- Martin E, Joeri P, Loenneker T et al. (1999) Visual processing in infants and children studied using functional MRI. Pediatr Res 8, 1–6.
- Martin E, Kikinis R, Zuerrer M et al. (1988) Developmental stages of human brain: an MR study. J Comput Assist Tomogr 12, 917–922.
- Martin E, Thiel T, Joeri P et al. (2000) Effect of pentobarbital on visual processing in man. Hum Brain Mapp 10, 132–139.
- Mercuri E, Atkinson J, Braddick O et al. (1997) Basal ganglia damage and impaired visual function in the newborn infant. Arch Dis Child Fetal Neonatal Ed 77, F111–114.
- Nilsson L and Siesjö BK (1975) The effect of pentobarbitone anaesthesia on blood flow and oxygen consumption in the rat brain. Acta Anaesth Scand (Suppl) 57, 18–24.
- Ogawa M, Magata Y, Ouchi Y et al. (1994) Scopolamine abolishes cerebral blood flow response to somatosensory stimulation in anesthetized cats: PET study. Brain Res 650, 249–252.
- Ogawa S, Lee T, Kay A et al. (1990) Brain magnetic resonance imaging with contrast dependent on blood oxygenation. P Natl Acad Sci USA 87, 9868–9872.
- Ogawa S, Tank D, Menon R et al. (1992) Intrinsic signal changes accompanying sensory stimulation: functional brain mapping with magnetic resonance imaging. Proc Natl Acad Sci USA 89, 5951–5955.
- Posner M, Petersen S, Fox P et al. (1988) Localization of cognitive operations in the human brain. Science 240, 1627–1631.
- Prichard J, Rothman D, Novotny E et al. (1991) Lactate rise detected by H-1 NMR in human visual cortex during physiologic stimulation. Proc Natl Acad Sci USA 88, 5829–5831.
- Purves MJ (1978) Control of cerebral blood vessels: present state of the art. Ann Neurol 3, 377–383.
- Raichle ME, Grubb RL Jr, Gado MH et al. (1976) Correlation between regional cerebral blood flow and oxidative metabolism. In vivo studies in man. Arch Neurol 33, 523–526.
- Roy C and Sherrington C (1890) On the regulation of blood supply of the brain. J Physiol 11, 85–108.
- Schneider G (1969) Two visual systems. Science 163, 895–902.
- Snyder R, Hata S, Brann B et al. (1990) Subcortical visual function in the newborn. Pediatr Neurol 6, 333–336.
- Sokolow L (1981) Localization of functional activity in the central nervous system by measurement of glucose utilization with radioactive deoxyglucose. J Cereb Blood Flow Metab 1, 7–36.
- Stricker T, Martin E and Boesch C (1990) Development of the human cerebellum observed with high-field-strength MR imaging. Radiology 177, 431–435.
- Takahashi T, Shirane R, Sato S et al. (1999) Developmental changes of cerebral blood flow and oxygen metabolism in children. Am J Neuroradiol 20, 917–922.
- Tokumaru AM, Barkovich AJ, O’Uchi T et al. (1999) The evolution of cerebral blood flow in the developing brain: evaluation with iodine-123 iodoamphetamine SPECT and correlation with MR imaging. Am J Neuroradiol 20, 845–852.
- Turner R (1994) Magnetic resonance imaging of brain function. Ann Neurol 35, 637–638.
- Weinacht S, Kind C, Monting JS et al. (1999) Visual development in preterm and full-term infants: a prospective masked study. Invest Ophthalmol Vis Sci 40, 346–353.
- Yakovlev P and Lecours IAR (1967) The myelogenic cycles of regional maturation of the brain. In: Minowski A (Ed.) Regional Development of the Brain in Early Life. Philadelphia, FA Davis.