Ischemic lesions in the
preterm brain
Linda S de Vries, Floris Groenendaal and Linda C Meiners
Chapter Contents
Introduction
Only a small number of preterm infants develop severe ischemic lesions in the neonatal period, compared to a larger group of infants who develop severe intraventricular hemorrhages with or without parenchymal involvement. Even though extensive white matter damage is not common, it almost invariably leads to cerebral palsy later in infancy. Early recognition is of importance, enabling us to start appropriate guidance of both the child as well as the family. While extensive cysts in the periventricular white matter can be easily recognized with cranial ultrasound, smaller cysts or just increased periventricular echogenicity can be more difficult to identify. Several studies are in progress to assess the additional value of early neonatal MRI in these conditions.
Focal infarction, usually in the region of the middle cerebral artery is even less common and rarely reported in the literature. Both types of ischemic lesion are discussed and illustrated with images obtained with ultrasound as well as with MRI.
< prev | top | contents | next >
Periventricular leukomalacia (PVL)
White matter damage following hypoxia–ischemia was observed by pathologists as early as 1867, when Virchow first described yellowish white areas in the periventricular white matter36. The term periventricular leukomalacia (PVL) was first coined in 1962 by Banker and Larroche, as white (leukos) spots and softening (malacia) were seen in the periventricular white matter3. These early pathology studies were mostly restricted to infants with a gestational age of 34 weeks or more. Medical and technical developments of the last decades have allowed survival of infants with a gestational age of 23 weeks or above. Postmortem studies of these more immature infants show a more diffuse pattern of white matter damage, differing from the classical PVL as described by Banker and Larroche3. For the younger group some authors prefer the term ‘white matter damage’, to PVL. Autopsy findings very much depend on the duration between the insult and the time of death25. A large number of astrocytes and macrophages are often noted in the affected area after several days. Liquefaction of the center of the necrotic area can occur after 10–20 days. Liquefaction can result in small cavities, usually not in communication with the lateral ventricle. In the majority of the cases, however, only gliosis and calcification develop in the affected area, without cavitation. Eventually the cystic lesions disappear and ex-vacuo dilatation of the adjacent ventricle may then develop.
Although PVL is traditionally considered as an ischemic lesion and whilst many infants develop PVL following a well-documented clinical event, in many others the lesions are detected incidentally with cranial ultrasound. In the latter group it may not be possible to identify any episodes of severe hypoxia–ischemia, although in some infants there may be a history of sepsis or clinical evidence of infection (Fig. 8.7). It is clear that factors other than ischemia play an important role in white matter damage. The increased vulnerability of the immature oligodendrocyte to glutamate has been shown using cultured oligodendroglia1. The proinflammatory cytokines have been associated with the development of white matter damage and may even play a role before delivery. An association of raised IL-1b, IL-6 and TNF-a studied in the amniotic fluid, as well as in the cord blood, and white matter disease is now well established, with data coming from both animal experiments as well as from clinical studies38. Cytotoxic cytokines can, however, also be released during ischemia28. PVL may also be associated with postnatal events. All infants with clinical deterioration, for example secondary to sepsis, should have regular ultrasound examinations over the following weeks. Complications occurring after delivery may also be related to mechanical ventilation. Vasoconstriction due to hypocarbia is a common risk factor and care should be taken to avoid this, especially when using high frequency ventilation.
CRANIAL ULTRASOUND
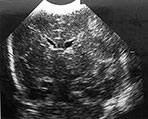
Since 1983 many groups have shown that cystic PVL can be diagnosed using cranial ultrasound32. Correlation with autopsy findings varies in the different studies published during the last decade. The sensitivity was very high in the infants who died once cystic lesions had developed. A high number of false negatives was found, by some, in infants with non-cavitating PVL, as small areas of PVL and diffuse gliosis often went unnoticed on cranial ultrasound15. Other groups, however, were able to show a good correlation in these non-cystic cases32. Serial ultrasound scans for a long enough period of time (several weeks) are essential when trying to diagnose PVL. An area of echodensity appears between 24 and 48h following a known insult but cysts do not evolve for a further 2–4 weeks. Although there is not one accepted classification system for PVL, the following one may be used8:
- Grade I: areas of increased echogenicity, usually seen within 24–48h after an insult and persisting beyond day 7 but not evolving into cysts.
- Grade II: localized small cysts, often located in the fronto-parietal periventricular white matter.
- Grade III: extensive cystic lesions, often particularly prominent in the parieto-occipital periventricular white matter. The cysts usually do not communicate with the lateral ventricle. They collapse after several weeks and are no longer visible on cranial ultrasound once the child is 2–3 months old. At this stage, irregular ex-vacuo ventricular dilatation can be noted, due to atrophy of the periventricular white matter8.
- Grade IV: extensive cystic lesions extending into the deep (subcortical) white matter.
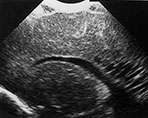
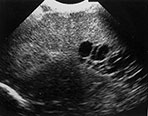
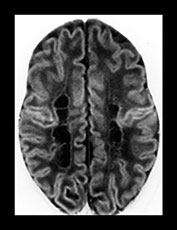
Fig. 8.1 (a), (b) Cranial ultrasound, parasagittal views showing extensive cystic lesions at 3 weeks of age. The cysts are separate from the lateral ventricle. (c) MRI performed at 40 weeks PMA. At the level of the central semiovale (CSO) the cysts can be seen as well-delineated hypointense areas, extending throughout the parietal white matter on this inversion recovery image (type A).


Fig. 8.2 Ultrasound performed at 3 and 6 weeks of age in an infant, born at 29 weeks. Coronal views angled backwards, showing patchy areas of increased echogenicity in the parieto-occipital white matter (a). Some cysts are seen, more on the right than on the left side. A repeat ultrasound at 40 weeks PMA shows extensive cysts throughout the periventricular white matter, more on the right than on the left (b).


Fig. 8.3 (a) Transverse MR inversion recovery image of the same infant at 3 weeks of age, at the level of the CSO, shows areas of increased signal, suggestive of hemorrhage (open arrowhead) (type C) and areas of low signal suggestive of cavitation (type B). (b) A repeat MR, IR, performed at 40 weeks PMA, shows extensive areas of cavitation (type A). The septi are not seen as clearly as on ultrasound.
COMPUTED TOMOGRAPHY
Computed tomography (CT) is of limited value in the diagnosis of PVL. In the acute stage, non-hemorrhagic PVL cannot be recognized as the high water content of the immature brain results in insufficient contrast between normal brain tissue and areas affected by hypoxia–ischemia. At a later stage, the specific shape of the lateral ventricles, the decrease in white matter and the prominent deep sulci can be appreciated on CT4.
MRI
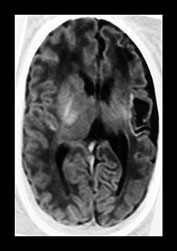
The first MRI studies describing infants with an ultrasound diagnosis of PVL stem from the mid-1980s. At that time MRI investigations were usually performed during the first or second year of life, once the child had developed signs of cerebral palsy2, 12, 13Subsequently, studies were published of MRI findings in infants with spastic diplegia, without knowledge of previous ultrasound data20. Baker et al.2 were the first to describe the classical triad of MRI findings from infancy onwards, consisting of (i) ventriculomegaly with irregular outline of the body and trigone of the lateral ventricle; (ii) reduced amount of white matter, especially at the level of the trigone, frequently also extending throughout the centrum semiovale and (iii) deep prominent sulci, abutting the ventricle. These findings can be identified on both T1 and T2 weighted imaging. MRI has the advantage that an increased signal intensity on T2 weighted imaging highlights areas of presumed gliosis. Once myelination has occurred, the fluid attenuated inversion recovery (FLAIR) sequence is particularly useful for demonstrating periventricular and cortical gliosis. The attenuated (low) signal of CSF with the high signal of most parenchymal pathology, enhances the detection of lesions adjacent to CSF spaces.
Baker et al.2 emphasized the possible presence of an area of normally increased signal intensity on T2 weighted images, dorsal and superior to the trigone of the lateral ventricles, not to be mistaken for areas of gliosis. These areas are referred to as ‘terminal zones’, representing association tracts, which contain less myelinated axons, throughout the first decade. This lower myelination density leads to higher signal on T2 weighted images. These areas are separated from the lateral ventricle by a thin rim of normal myelin. This feature distinguishes them from the abnormal signal seen in cases with PVL, abutting the ventricular wall. Furthermore, no loss of white matter is seen in the terminal zones and the ventricles should be of a normal size and shape. The differentiation is best made on coronal slices.
One of the first neonatal MRI studies did not compare ultrasound and MRI findings, but studied whether progress in myelination at 44 weeks postmenstrual age was affected by the occurrence of an intraventricular hemorrhage or cystic-PVL (c-PVL)34. Infants with c-PVL had a significantly delayed myelination, using T1 weighted axial images, compared with both infants without ultrasound abnormalities as well as those with intraventricular hemorrhages of different degrees. They subsequently reported that there was a significant correlation between the delayed myelination and neurodevelopmental outcome at 1 year14.
More recently neonatal MRI studies in neonates with PVL have been performed in several centers, both very early, in the non-cystic stage, and also later, once the cysts have developed30, 35. A recent study by Maalouf et al.22 showed that a large number of infants with a gestational age (GA) below 30 weeks (22/29) have diffuse and excessive high signal intensity in the white matter (DEHSI) on T2 weighted images at term age. This was commonly associated with imaging signs suggestive of cerebral atrophy, ventricular dilation and widening of the extracerebral space, and they therefore suggested this to be a sign of white matter disease. These white matter appearances may be non-specific but look very similar to the white matter signal intensity in non-cystic areas in infants with PVL (see Fig. 3.24) and may represent a mild form of diffuse white matter damage.
In addition to conventional sequences, sequences such as diffusion weighted imaging (DWI) and quantitative 3-D volumetric imaging17, 18 have been used to assess the preterm neonatal brain. Inder et al. reported on a case that developed extensive c-PVL17. DWI, performed on day 5 in the absence of ultrasound abnormalities, showed diffuse abnormalities throughout the white matter on DWI. A repeat MRI confirmed the development of cystic lesions. The association between PVL and the development of apparently undamaged regions of the brain has been shown in a more recent study by the same group. They were able to show a reduction in the gray matter volume using 3-D volumetric imaging at term age in those with PVL compared with normal controls and preterm infants without PVL18.
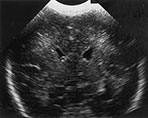

Fig. 8.4 Cranial ultrasound, coronal views, performed 2 days and 21 days following an episode of severe hypocarbia, showing areas of mild echogenicity at the external angle of the lateral ventricle (a) evolving into localized cysts (b).

Fig. 8.5 Same infant as in Fig. 8.4, transverse MRI, heavily T2 weighted spin-echo image at 40 weeks PMA, showing one small area of high signal intensity on the right at the level of the CSO, compatible with a small cyst (arrow). Many small areas of low signal intensity can be seen throughout the white matter, suggestive of hypercellular lesions (arrowheads) (type D). (With permission Roelants et al. 2001 Neuropediatrics27.)


Fig. 8.6 Preterm infant, born at 28 weeks, who developed grade I PVL on cranial ultrasound, as can be seen on coronal (a) and parasagittal (b) view. MRI, heavily T2 weighted spin-echo image (c) at 32 weeksí PMA, shows increased signal intensity of the periventricular white matter, bordered by a rim of low signal intensity.


Fig. 8.7 Preterm infant, born at 29 weeks, who developed therapy-resistant seizures at 36 weeks PMA. Enterovirus was cultured from nose and throat. Ultrasound, coronal views, showed areas of increased echogenicity 48h after the onset of the seizures. Also note the increased echogenicity in the right thalamus (a). Evolution into cysts, extending into the deep white matter is seen 10 days later (b). MRI was performed at this stage (38 weeks PMA) (c). Coronal FLAIR, shows extensive areas of low signal intensity compatible with CSF. The septation of the cystic zone cannot be recognized on MRI, as on ultrasound. Additional cysts in both temporal lobes were, however, noted on MRI and not seen on ultrasound. (c: with permission Roelants et al. 2001 Neuropediatrics27. )


Fig. 8.8 Hydropic preterm infant, born at 32 weeks. Following a period of severe and prolonged hypotension, marked echogenicity was noted and extensive cysts subsequently developed. Coronal (a) and parasagittal (b) views at 2 weeks of age, using a 10MHz transducer. A large subendymal pseudocyst is seen on the left as well as the bilateral onset of the development of diffuse cystic degeneration in the periventricular and deep white matter. (c) MRI of the same infant, inversion recovery sequence, performed on the same day, shows petechial hemorrhages within the white matter, as well as extensive areas of low signal intensity throughout the periventricular and deep white matter. (With permission Roelants et al. 2001 Neuropediatrics27.)
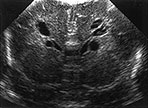


Fig. 8.9 Coronal (a) and parasagittal (b) views at 6 weeks of age, using a 10MHz transducer. Following weekly ultrasound examinations, extensive cysts have developed, not preceded by severe echogenicity. Also note the subependymal pseudocysts. MRI, performed on the same day shows areas of high signal intensity on a heavily T2 weighted spin-echo image (c) and high signal intensity areas adjacent to these cystic areas on DWI (d).
COMPARISON STUDIES
MRI and postmortem
In a correlation study by Schouman-Claeys et al.29, MRI data were compared with autopsy findings in eight preterm infants, with a GA ≤33 weeks, who died between 3 and 7 weeks of age. Death occurred 3–11 days following the MRI scan. Four types of abnormalities with different signal intensities were recognized on MRI, using coronal T1 weighted images. In type A the zones had a signal intensity similar to that of CSF. These correlated with cavities at postmortem in all cases (Fig. 8.1). In type B the zones were of moderately low signal with less clearly demarcated boundaries than in type A. These areas corresponded with translucent sparsely cellular patches or small cavities. In type C the zones were of very high signal intensity and sometimes heterogeneous. These areas correlated with hemorrhagic cavities (Fig. 8.2 and Fig. 8.3). In type D the zones had a moderately high signal appearing as streaks or punctate areas. These areas correlated with hypercellular lesions with or without siderophages (Fig. 8.4 and Fig. 8.5). The extent of periventricular lesions was underestimated on MRI and small thalamic lesions were overlooked in three cases. On the whole, a precise evaluation of PVL was possible using T1 weighted MR images.
MRI AND ULTRASOUND
Neonatal period
Several comparison studies have been reported, performed in the neonatal period as well as later in infancy19, 24, 25, 30, 35. Keeney et al.19 enrolled 100 high-risk newborns, admitted to their neonatal intensive care unit, into a prospective MRI study. Twelve cases were identified as having PVL and 10 of these 12 cases had already been detected using ultrasound. Four of the 12 cases were also examined with CT, and PVL was detected in only one of them. In all 12 cases MRI showed hemorrhagic lesions, when scanned before the end of the 4th week of life. When the MRI was done between 4 and 8 weeks of age, cysts were seen. By 8 weeks of age resolution of cysts was noted with or without the appearance of ventricular dilatation.
Van Wezel-Meijler et al.35 studied 25 infants with ‘flares’ (defined as areas of increased echogenicity, present for 1–6 days, (n = 15) or PVL grade 1 (n = 10) on ultrasound. Echogenicity was defined as echogenic or less echogenic than the choroid plexus, but not inhomogeneous. The broader zones of signal intensity changes within the white matter on MRI corresponded with periventricular echo densities seen on ultrasound. Sie et al. have also studied infants with inhomogeneous (‘patchy’) flares with or without cystic evolution30. They were able to show that hemorrhagic PVL was more common (60%) than reported previously in postmortem studies (25%) and that the cysts were noted to be more numerous and sometimes seen earlier on MRI than on ultrasound.
In our own population we have been able to study 35 cases with different grades of PVL. The infants were studied in the neonatal period using a Philips imaging system operating at 1.5 Tesla (Table 8.1). Proton MR spectroscopy was performed during the same session. Most infants studied so far had cystic PVL (3 grade I, 10 grade II and 22 grade III). The scan was performed within the first 4 weeks of life in 15 infants (3 grade I, 3 grade II, 9 grade III), at 6 weeks of age in 1 with grade III and at 40 weeks’ postmenstrual age in 19 infants (7 grade II and 12 grade III). The MRI was performed twice during the neonatal period in two infants. Punctate high signal changes on inverse recovery (IR) were seen in all our grade I (Fig. 8.6), 1 of the grade II and 5 of the grade III cases and all of these had their examination within the first 4 weeks. This finding was not present in any of the infants who had their first scan at 40 weeks postmenstrual age (PMA). Two infants, however, showed linear streaks of low signal on T2 weighted sequence at the level of the centrum semiovale (CSO) (Fig. 8.5). In five of our cases with localized cysts on ultrasound (grade II), the cysts could no longer be visualized at the time of the MRI examination (40 weeks) by either technique. In these patients only mild ventricular dilatation was noted, sometimes associated with a rim of short T1 outlining the lateral ventricle, suggestive of a glial cell reaction. In three infants abnormalities were found on MRI which were not seen using ultrasound. In one infant an unexpected area of infarction was identified in the striatum. In another case (Fig. 8.7) small cysts were also seen in the temporal lobes and in the third case, a lesion was also found in the cerebellum. In general, there was good agreement between ultrasound and MRI, when performed around 40 weeks’ PMA. However, using MRI cysts were seen earlier, appeared more extensive (Fig. 8.8) and appeared to be associated with petechial hemorrhages when the infants were studied at an early stage (2–4 weeks after the insult). In our most recent case DWI was performed at 6 weeks of age, when the cysts were already present on both ultrasound and on conventional T1 and T2 weighted sequences. Extensive areas of high signal intensity were seen on DWI adjacent to the cystic lesions possibly preceding further cystic degeneration (Fig. 8.9).
Table 8.1 Pulse sequence parameters in the neonatal period
| Pulse sequence | TR (ms) | T1 (ms) | TE (ms) |
|---|---|---|---|
| T1 weighted CSE | 514 | – | 15 |
| T2 weighted TSE | 4211 | – | 150 |
| IR | 3347 | 600 | 30 |
| TE, echo time; TR, repetition time; TI, time to inversion; IR, inverse recovery; CSE, conventional spin echo; TSE, turbo spin echo. | |||
< prev | top | contents | next >
Antenatal onset
Cranial ultrasound noted cystic lesions, present on day 1, in only three cases. In two of them their monozygous co-twin had died 2–3 weeks previously (Fig. 8.10) and in the third case the mother had been physically assaulted 4 weeks prior to delivery. The fourth case had areas of increased periventricular echogenicity, associated with an intraventricular hemorrhage, present on the first ultrasound scan following acute loss of fetal movements 2 days prior to an emergency cesarian section.


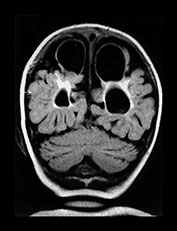
Fig. 8.10 Preterm infant born at 32 weeks, following death of his monozygous co-twin. (a) Parasagittal T1 weighted image shows a large parietal cystic defect. Also note the small rim of low signal intensity runs alongside the wall of the lateral ventricle (arrowheads). These abnormalities were present in both hemispheres. (b) A repeat parasagittal T1 weighted image at 15 months corrected age shows a reduction in the size of the cystic defect, although the angulation is different. (c) A coronal FLAIR shows large bilateral parietal cysts as well as extensive gliosis around the lateral ventricles.
So far only 16 of the 29 surviving infants who had a neonatal MRI have had a repeat scan during the second year of life. A good correlation was found between areas of gliosis in infancy and the cystic lesions seen during the neonatal period.
Infancy
MRI compared with neonatal ultrasound
Comparison of MRI, performed during infancy, with previous ultrasound data, was first carried out in the late 1980s. De Vries et al.7 performed sequential MRI studies, between 36 weeks PMA and 36 months in 13 cases with extensive c-PVL or subcortical leukomalacia. Both imaging data as well as neurodevelopmental outcome differed between those with cysts restricted to the periventricular white matter and those where the cysts extended into the deep white matter. In the latter group cysts usually persisted on late MRI scans and little or no myelination was found. From the clinical point of view this group also showed more severe motor and mental impairment as well as cerebral visual impairment. They subsequently studied 15 infants, who developed cerebral palsy, following persistent echo densities (grade I, n = 5), localized c-PVL (grade II, n = 4) or extensive c-PVL (grade III, n = 6)9. There was good correlation between the degree of PVL diagnosed using ultrasound and the extent of the MRI changes noted in infancy. Periventricular high signal intensity (PVHI) on T2 weighted images was present in all cases but was most extensive in the grade III cases. In the grade II cases, with only a few small cysts on ultrasound, PVHI on T2 weighted images and associated ventricular dilatation, was more extensive than expected. Irregular ventricular enlargement was only seen in those with c-PVL.
MRI and neurodevelopmental outcome
In order to correlate abnormalities on MRI with neurodevelopmental outcome, many groups have performed MRI in infancy in children with spastic diplegia or quadriplegia. When assessing MRI, attention has been paid to the following characteristics33: thinning of the corpus callosum, irregular ventricular shape, ventricular enlargement, diminished peritrigonal white matter, delay in myelination, PVHI on T2 weighted images and the presence of cortical damage. In general, there appears to be a good agreement between the severity of MRI abnormalities and the severity of motor and cognitive sequelae6, 31, 33, 37All studies have shown that the extent of PVHI, the degree of white matter reduction and ventricular enlargement correlated with the degree of motor impairment. Some authors found a correlation between the degree of these abnormalities and cognitive development6. This was, however, not confirmed by others (Fig. 8.11)37.
Iai et al.16 further emphasized that the ratio of the thickness of the splenium divided by the length of the corpus callosum correlates with severity of motor impairment (Fig. 8.11).
Table 8.2 Pulse sequence parameters in infancy
| Pulse sequence | TR (ms) | T1 (ms) | TE (ms) |
|---|---|---|---|
| T1 weighted CSE | 544 | – | 16 |
| T2 weighted TSE | 3072 | – | 50/150 |
| IR | 2818 | 600 | 20 |
| FLAIR | 7565 | 2000 | 120 |
| TE, echo time; TR, repetition time; TI, time to inversion; IR, inverse recovery; FLAIR, fluid attenuated inverse recovery; CSE, conventional spin echo; TSE, turbo spin echo. | |||
< prev | top | contents | next >
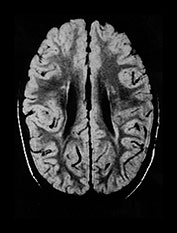
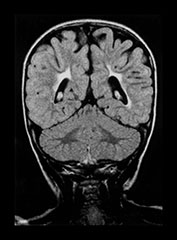
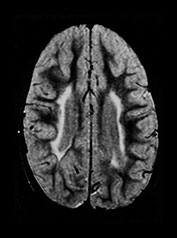

Fig. 8.11 (a) MRI performed at 2.5 years of age in an infant with a grade I PVL on ultrasound. T2 TSE (3000/50), axial slice at mid-ventricular level. Small areas of PVHI and slight reduction in peritrigonal white matter are seen, more extensive on the left. (b) MRI performed at 22 months of age, in an infant with PVL grade II on neonatal ultrasound. FLAIR sequence, coronal slice. Extensive PVHI involving the optic radiation is noted on both sides. The left ventricle is mildly dilated and slightly irregular in shape. (c) MRI performed at 24 months of age in an infant with PVL grade III on neonatal ultrasound (same infant as Fig. 8.1). T2 TSE (3000/50), axial slice at the mid-ventricular level, shows extensive areas of PVHI and irregularly dilated ventricles. (d) MRI performed at 15 months of age in an infant with PVL III on neonatal ultrasound. Mid-sagittal T1 weighted image, showing marked thinning of especially the dorsal part of the corpus callosum.

Fig. 8.12 Transverse MRI, IR, performed at 16 months in an infant born at 37 weeks. Severe encephalopathy was present following a twin-to-twin transfusion syndrome. There is mild ex-vacuo dilatation, severe delay in myelination, and extensive damage to the occipital white matter and cortex.
MRI and cerebral visual impairment
A number of studies have shown a correlation between cerebral visual impairment (CVI) and the presence of MR abnormalities of the posterior visual pathways in infants with PVL55, 11, 21, CVI is regarded as visual impairment due to a disturbance to the posterior pathways, that is the optic radiation and/or the primary visual cortex. Cioni et al.5 studied 30 infants with grade I and II (n = 18) or grade III (n = 12) PVL. They found that half of the cases with grade III PVL had severe loss of visual acuity, reduced visual field and abnormal ocular motility, but none was completely blind. On MRI, abnormalities in the optic radiation were found in 50%. In 17% the visual cortex was also affected. They suggested that lesions at the level of the optic radiation, rather than lesions in the visual cortex itself, are the anatomical substrates for CVI in preterm infants.
Eken et al.11 prospectively studied a cohort of 65 high-risk preterm and full-term newborns, admitted to our neonatal intensive care unit. Nine developed severe CVI and were functioning as blind children. All had a GA ≥35 weeks and all showed extensive cysts on ultrasound extending into the subcortical white matter. They showed severe abnormalities on MRI, involving both the optic radiation as well as the visual cortex (Fig. 8.12).
< prev | top | contents | next >
Infarction
Focal infarction is often referred to as ‘neonatal stroke’. It has mainly been reported in full-term infants, who tend to present with hemiconvulsions during the first few days of life (see Chapter 7). Data on preterm infants are scarce. Paneth et al.26 reported that 17% of their postmortem cases, belonging to a cohort of preterm infants born in the New Jersey counties between 1984 and 1987, had lesions in the thalami or basal ganglia.
We have studied 23 infants with a GA <37 weeks with focal infarction. Seventeen of these have been described previously10. In 19 of these 23 cases an MRI was performed, either in the neonatal period (n = 17) or later in infancy (n = 2). Abnormalities on ultrasound were hardly ever seen during the first few days of life. A gradual increase in echogenicity was first noted by the end of the first week. In two of the 23 cases the infarction was first noted in the cystic phase, having been missed during their echogenic phase, either due to a very anterior or a very peripheral location of the lesion. The lesions sometimes remained echogenic up till term age, but usually became cystic on ultrasound. Two infants had an associated IVH with posthemorrhagic ventricular dilatation and three other cases also showed c-PVL.
Neonatal MRIs were performed around 40 weeks’ PMA, once cystic evolution had taken place on ultrasound. In all but one of the infants, the lesion had been identified on ultrasound and this was the reason for performing the MRI. Three infants had involvement of the main branch of the middle cerebral artery, one had an infarct in the distribution of the posterior cerebral artery and one of the anterior cerebral artery. Nine showed involvement of one or more lenticulostriate branches, two had cortical branch involvement and one showed a watershed infarction between areas supplied by the middle and anterior cerebral artery.
MRI
Infarction was seen as an area of low signal intensity on IR and increased signal intensity on T2 weighted spin echo sequences. An additional finding of a previous hemorrhage within the area of infarction was present in only two cases (Fig. 8.13). The posterior limb of the internal capsule of the affected hemisphere may also be involved (Fig. 8.14). This presents as a decrease in signal on IR images and an increase in signal on T2 weighted images.


Fig. 8.13 (a) Transverse MRI, IR, performed at 40 weeks’ PMA in an infant born at 36 weeks’ GA, with a hemorrhagic occipital parenchymal lobe infarction, associated with coagulopathy. He did not develop any asymmetry in tone but had a global delay with a DQ of 71 at 24 months of age. (b) Transverse MRI, FLAIR sequence, performed at the age of 56 years, showing the residual damage following the infarction. Mild gliosis is seen in the occipital white matter on the right side.

Fig. 8.14 MRI in a preterm infant with a GA of 32 weeks. Routine US performed at 2 weeks of age shows cystic changes in the distribution of the right middle cerebral artery. MRI, IR, axial slice, performed at 40 weeks PMA, shows an area of cavitation and ex-vacuo dilatation of the right ventricle. Also note the absence of myelination of the posterior limb of the right internal capsule. He developed a moderate hemiplegia and has a DQ of 91 at 24 months of age.
ANTENATAL ONSET
In five of the 23 cases the infarction was considered to be of antenatal onset. Three were part of a twin-to-twin transfusion syndrome, one was one of triplets and the last case suffered severe arrythmia before delivery (Fig. 8.15). One of the twins had involvement of the main branch and in the other three the lenticulostriate branches were involved.

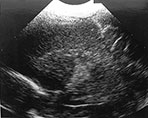
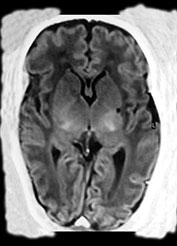
Fig. 8.15 (a, b) Ultrasound at 2 weeks of age in a preterm infant born at 33 weeks GA, following antenatal supraventricular tachycardia, showing an echodensity in the left lentiform nucleus. (c) MRI, IR sequence, performed at 38 weeks PMA, showing a small cyst in the left putamen. (With permission Govaert and de Vries, Clin Dev Med 1998 and Neuropediatrics, 1997.)
NEURODEVELOPMENTAL OUTCOME
The three infants with main branch involvement of the middle cerebral artery developed a hemiplegia in contrast to the two cases with either a posterior or anterior infarction. Among those with smaller infarcts, eight out of 18 have so far developed adverse neurological sequelae, due to associated c-PVL in two, and due to the lacunar infarcts in the other six cases.
< prev | top | contents | next >
Case histories
CASE 8.1
Female infant, born following an emergency cesarian section at 31 weeks’ gestation, because of decelerations on the CTG.
Her first cranial ultrasound scan, performed on day 1, showed areas of increased echogenicity. Periventricular cysts started to develop from day 13 onwards. On day 9 an area of increased echogenicity was also noted in the right caudate nucleus.
The first MRI was performed at 40 weeks’ postmenstrual age. The inversion recovery images show areas of low signal intensity, similar to that of CSF, mainly in the frontal white matter, at a low ventricular level (Fig. 8.16). At the level of the CSO a few more areas with low signal are noted, suggestive of cavitation (type A) (arrow) (Fig. 8.17). More posteriorly a streaky line of high signal is noted, suggestive of a glial cell reaction or mineralization (type D) (arrowheads).
A second MRI was done at 24 months of age. A coronal FLAIR still shows the small cavity at the level of the right caudate nucleus and areas of high signal intensity at the level of the corticospinal tracts (Fig. 8.18). An axial proton density SE sequence shows high signal intensity throughout the CSO extending into the parietal white matter (Fig. 8.19). Also note the linear area of low SI at the same site as the neonatal IR, suggestive of mineralization (arrowheads).
This girl is now 2 years old. She has developed a spastic diplegia and also shows some dystonic hand movements. She is not yet able to speak and has a developmental quotient (DQ) of 70 uncorrected and 80 corrected for her prematurity (excluding the motor subscale).
CASE 8.2
Female infant born following an emergency cesarian section at 33 weeks, because of signs of fetal distress on the CTG and a reverse flow on Doppler studies of the umbilical cord. Mother suffered a ‘flu-like episode’ 5 weeks prior to delivery.
She had a good start (Apgar 7 at 1min and 9 at 5min). She weighed 1.5kg (p 10–50), had a length of 42cm (p 3–10) and a head circumference of 30cm (p 10–50). Routine lab results showed a low platelet count of 35 x 109/l. She was diagnosed to have a congenital cytomegalovirus (CMV) infection.
Her first ultrasound scan after referral on day 9 did not show any areas of periventricular calcification or lenticulostriate vasculopathy. However, she had areas of increased echogenicity throughout the left hemisphere (Fig. 8.20a) She was scanned again 4 weeks later and by then she had developed some cysts in these previously echogenic areas (Fig. 8.20b)
An MRI was performed at 40 weeks’ postmenstrual age and the area of focal infarction in the region of the middle cerebral artery was confirmed (Fig. 8.21). Note the line of high signal surrounding the area of infarction, suggestive of hemorrhage or a glial cell reaction. Also note the absence of the posterior limb of the internal capsule on the affected side.
Although occipital cysts can be found in cases with congenital CMV infection, the cystic lesion in this infant is unlikely to be due to the late onset CMV infection in this case. Considering the timing of the CMV infection, and the timing of the cystic evolution on ultrasound, the infarcts were more likely to result from prolonged fetal distress before and around the time of delivery.
She is now 30 months old. She has mild sensorineural hearing loss. She shows a mild asymmetry in tone and has a DQ of 87 uncorrected and 92 corrected for her prematurity. Her head circumference is below the 3rd centile (43cm) with weight and length on the 50th centile.
< prev | top | contents | next >
Summary
- Cerebral ischemic lesions in the preterm infant can be diagnosed using MRI in the neonatal period.
- MRI changes of the white matter, following hypoxia–ischemia have been studied both in the early neonatal period as well as in the first decade of life.
- So far it is uncertain whether MRI provides additional information compared to repeated neonatal ultrasound in the neonatal period, although there is increasing amount of data to suggest this. Especially when using non-conventional sequences such as DWI in the echogenic stage of PVL subsequent evolution into cystic lesions may be predicted.
- It is possible that quantitative 3-D volumetric MRI to measure structures such as the cortex can help in the prediction of future cognitive defects.
- MRI is also a very useful technique to detect focal ischemic lesions in the preterm brain. Different patterns of ‘neonatal stroke’ have been identified.
- Future studies of cerebral ischemic lesions in the preterm infant may help in defining the physiological mechanisms underlying these lesions. These studies may eventually lead to interventions to reduce brain damage.
< prev | top | contents | next >
References
- Back SA, Gan X, Li Y et al. (1998) Maturation-dependent vulnerability of oligodendrocytes to oxidative stress-induced death caused by glutathione depletion. J Neurosc 18, 6241–6253.
- Baker LL, Stevenson DK and Enzmann DR (1988) End-stage periventricular leukomalacia: MR evaluation. Radiology 168, 809–815.
- Banker BQ and Larroche J-L (1962) Periventricular leukomalacia in infancy: a form of neonatal anoxic encephalopathy. Arch Neurol 7, 386–410.
- Chow PP, Horgan JG and Taylor KJW (1985) Neonatal periventricular leukomalacia: real-time sonographic diagnosis with CT correlation. Am J Neuroradiol 6, 383–388.
- Cioni G, Fazzi B, Ipata AE et al. (1996) Correlation between cerebral visual impairment and magnetic resonance imaging in children with neonatal encephalopathy. Dev Med Child Neurol 38, 120–132.
- Cioni G, Di Paco MC, Bertuccelli B et al. (1997) MRI findings and sensorimotor development in infants with bilateral spastic cerebral palsy. Brain Dev 19, 245–253.
- De Vries LS, Connell JA, Dubowitz LMS et al. (1987) Electrophysiological, neurological and MRI abnormalities in infants with extensive cystic leukomalacia. Neuropediatrics 18, 61–66.
- De Vries LS, Eken P and Dubowitz LMS (1992) The spectrum of leukomalacia using cranial ultrasound. Beh Brain Res 49, 1–6.
- De Vries LS, Eken P, Groenendaal F, et al. (1993) Correlation between the degree of periventricular leukomalacia diagnosed using cranial ultrasound and MRI later in infancy in children with cerebral palsy. Neuropediatrics 24, 263–268.
- De Vries LS, Groenendaal F, Eken P et al. (1997) Infarcts in the vascular distribution of the middle cerebral artery in preterm and fullterm infants. Neuropediatrics 28, 88–96.
- Eken P, de Vries LS, van Nieuwenhuizen O et al. (1996) Early predictors of cerebral visual impairment in infants with cystic leukomalacia. Neuropediatrics 27, 16–25.
- Feldman HM, Scher MS and Kemp SS (1990) Neurodevelopmental outcome of children with evidence of periventricular leukomalacia on late MRI. Pediatr Neurol 6, 296–302.
- Flodmark O, Lupton B, Li D et al. (1989) MR imaging of periventricular leukomalacia in childhood. Am J Neuroradiol 10, 111–118.
- Guit GL, van de Bor M, den Ouden L et al. (1990) Prediction of neurodevelopmental outcome in the preterm infant: MR staged myelination compared with US. Radiology 175, 107–109.
- Hope PL, Gould SJ, Howard S et al. (1988) Ultrasound diagnosis of pathologically verified lesions in the brains of very preterm infants. Dev Med Child Neurol 30, 457–471.
- Iai M, Tanabe Y, Goto M et al. (1994) A comparative magnetic resonance imaging study of the corpus callosum in neurologically normal children and children with spastic diplegia. Acta Paediatr 83, 1086–1090.
- Inder T, Huppi P, Zientara GP et al. (1999) Early detection of periventricular leukomalacia by diffusion-weighted magnetic resonance imaging techniques. J Pediatr 134, 631–634.
- Inder TE, Hüppi PS, Warfield S et al. (1999) Periventricular white matter injury in the premature infant is followed by reduced cerebral cortical gray matter volume at term. Ann Neurol 46, 755–760.
- Keeney SE, Adcock EW and McArdle CB (1991) Prospective observations of 100 high-risk neonates by high field (1.5 Tesla) magnetic resonance imaging of the central nervous system; II: Hypoxic–ischaemic encephalopathy. Pediatrics 87, 431–438.
- Koeda T, Suganama I, Kohno Y et al. (1990) MR imaging of spastic diplegia. Comparative study between preterm and term infants. Neuroradiology 32, 187–190.
- Lanzi G, Fazzi E, Uggetti C et al. (1998) Cerebral visual impairment in periventricular leukomalacia. Neuropediatrics 29, 145–150.
- Maalouf EF, Duggan PJ, Rutherford MA et al. (1999) Magnetic resonance imaging of the brain in a cohort of extremely preterm infants. J Pediatr 135, 351–357.
- Maalouf EF, Duggan PJ, Counsell SJ et al. Comparison of findings on cranial ultrasound and magnetic resonance imaging in preterm infants. Pediatrics 2001; 107:719–727.
- Millet V, Bartoli JM, Lacroze V et al. (1998) Predictive significance of magnetic resonance imaging at 4 months of adjusted age after a perinatal insult. Biol Neonate 73, 207–219.
- Paneth N, Rudelli R, Monte W et al. (1990) White matter necrosis in very low birth weight infants: neuropathologic and ultrasonographic findings in infants surviving six days or longer. J Pediatr 116, 975–984.
- Paneth N, Rudelli R, Kazam E et al. (1994) Associated pathologic lesions: cerebellar haemorrhage, pontosubicular necrosis, basal ganglia necrosis. In: Brain Damage in the Preterm Infant. Clin Dev Med 131, London, MacKeith Press, pp. 163–170.
- Roelants-van Rijn AM, Groenendaal F, Beek FJ et al. Neuropediatrics: in press. Parenchymal brain injury in the preterm infant: comparison of cranial ultrasound, MRI and neurodevelopmental outcome.
- Savman K, Blennow M, Gustafson K et al. (1998) Cytokine response in cerebrospinal fluid after birth asphyxia. Pediatr Res 43, 746–751.
- Schouman-Claeys E, Henry-Feugeas MC, Roset F et al. (1993) Periventricular leukomalacia: correlation between MR imaging and autopsy findings during the first 2 months of life. Radiology 189, 59–64.
- Sie LTL, van der Knaap MS, van Wezel-Meijler G et al. (2000) Early MR features of hypoxic ischaemic brain injury in neonates with periventricular densities on sonograms. Am J Neuroradiol 21, 852–861.
- Sugita K, Takeuchi A, Iai M et al. (1989) Neurologic sequelae and MRI in low-birth weight patients. Paediatr Neurol 5, 365–369.
- Trounce JQ, Fagan D and Levene MI (1986) Intraventricular haemorrhage and periventricular leukomalacia: ultrasound and autopsy correlation. Arch Dis Child 61, 1203–1207.
- Truwit CL, Barkovich AJ, Koch TK et al. (1992) Cerebral Palsy: MR findings in 40 patients. Am J Neuroradiol 13, 67–78.
- van de Bor M, Guit GL, Schreuder AM et al. (1989) Early detection of delayed myelination in preterm infants. Pediatrics 84, 407–411.
- van Wezel-Meijler G, van der Knaap MS, Sie LTL et al. (1998) Magnetic resonance imaging of the brain in premature infants during the neonatal period. Normal phenomena and reflection of mild ultrasound abnormalities. Neuropediatrics 29, 89–96.
- Virchow R (1867) Zur pathologischen Anatomie des Gehirns I: congenitale encephalitis und myelitis. Arch Pathol Anat 38, 129–142.
- Yokochi K, Aiba K, Horie M et al. (1991) Magnetic resonance imaging in children with spastic diplegia: correlation with the severity of their motor and mental abnormality. Dev Med Child Neurol 33, 18–25.
- Yoon BH, Jun JK, Romero R et al. (1997) Amniotic fluid inflammatory cytokines (interleukin-6, interleukin-1beta and tumor necrosis factor-alpha), neonatal brain white matter lesions and cerebral palsy. Am J Obstetr Gyn 177, 19–26.


